View Poll Results: Nate Silver
- Voters
- 0. You may not vote on this poll
-
Alpha
-
Beta
-
Gamma
-
Delta
-
ILE
-
SEI
-
ESE
-
LII
-
EIE
-
LSI
-
SLE
-
IEI
-
SEE
-
ILI
-
LIE
-
ESI
-
LSE
-
EII
-
IEE
-
SLI
-
WE'RE ALL GOING HOME

 Nate Silver
Nate Silver: NT -- maybe ILI-Te? [Creative subtype] (ILI-ILE?)
http://www.scribd.com/doc/191801559/...di-Nate-Silver
- from The Signal and the Noise: Why So Many Predictions Failbut Some Dont by Nate Silver; pp.
47-54 (ARE YOU SMARTER THAN A TELEVISION PUNDIT?): For many people, political prediction is
synonymous with the television program The McLaughlin Group, a political roundtable that has
been broadcast continually each Sunday since 1982 and parodied by Saturday Night Live for nearly
as long. The show, hosted by John McLaughlin, a cantankerous octogenarian who ran a failed bid for the
United States Senate in 1970, treats political punditry as sport, cycling through four or five subjects in
the half hour, with McLaughlin barking at his panelists for answers on subjects from Australian politics to
the prospects for extraterrestrial intelligence.
At the end of each edition of The McLaughlin Group, the program has a final segment called
Predictions, in which the panelists are given a few seconds to weigh in on some matter of the day.
Sometimes, the panelists are permitted to pick a topic and make a prediction about anything even
vaguely related to politics. At other times, McLaughlin calls for a forced prediction, a sort of pop quiz
that asks them their take on a specific issue.
Some of McLaughlins questionssay, to name the next Supreme Court nominee from among several
plausible candidatesare difficult to answer. But others are softballs. On the weekend before the 2008
presidential election, for instance, McLaughlin asked his panelists whether John McCain or Barack
Obama was going to win.
That one ought not to have required much thought. Barack Obama had led John McCain in almost every
national poll since September 15, 2008, when the collapse of Lehman Brothers had ushered in the worst
economic slump since the Great Depression. Obama also led in almost every poll of almost every swing
state: in Ohio and Florida and Pennsylvania and New Hampshireand even in a few states that
Democrats dont normally win, like Colorado and Virginia. Statistical models like the one I developed for
Five-ThirtyEight suggested that Obama had in excess of a 95 percent chance of winning the election.
Betting markets were slightly more equivocal, but still had him as a 7 to 1 favorite.
But McLaughlins first panelist, Pat Buchanan, dodged the question. The undecideds will decide this
weekend, he remarked, drawing guffaws from the rest of the panel. Another guest, the Chicago
Tribunes Clarence Page, said the election was too close to call. Fox News Monica Crowley was bolder,
predicting a McCain win by half a point. Only Newsweeks Eleanor Clift stated the obvious, predicting a
win for the Obama-Biden ticket.
The following Tuesday, Obama became the president-elect with 365 electoral votes to John McCains
173almost exactly as polls and statistical models had anticipated. While not a landslide of historic
proportions, it certainly hadnt been too close to call: Obama had beaten John McCain by nearly ten
million votes. Anyone who had rendered a prediction to the contrary had some explaining to do.
There would be none of that on The McLaughlin Group when the same four panelists gathered
again the following week. [The McLaughlin Group transcript, Federal News Service; taped November 7,
2008. http://www.mclaughlin.com/transcript.htm?id=688 ] The panel discussed the statistical minutiae
of Obamas win, his selection of Rahm Emanuel as his chief of staff, and his relations with Russian
president Dmitry Medvedev. There was no mention of the failed predictionmade on national
television in contradiction to essentially all available evidence. In fact, the panelists made it sound as
though the outcome had been inevitable all along; Crowley explained that it had been a change
election year and that McCain had run a terrible campaignneglecting to mention that she had been
willing to bet on that campaign just a week earlier.
Rarely should a forecaster be judged on the basis of a single predictionbut this case may warrant an
exception. By the weekend before the election, perhaps the only plausible hypothesis to explain why
McCain could still win was if there was massive racial animus against Obama that had gone undetected
in the polls. None of the panelists offered this hypothesis, however. Instead they seemed to be
operating in an alternate universe in which the polls didnt exist, the economy hadnt collapsed, and
President Bush was still reasonably popular rather than dragging down McCain.
Nevertheless, I decided to check to see whether this was some sort of anomaly. Do the panelists on
The McLaughlin Groupwho are paid to talk about politics for a livinghave any real skill at
forecasting?
I evaluated nearly 1,000 predictions that were made on the final segment of the show by McLaughlin
and the rest of the panelists. About a quarter of the predictions were too vague to be analyzed or
concerned events in the far future. But I scored others on a five-point scale ranging from completely
false to completely true.
The panel may as well have been flipping coins. I determined 338 of their predictions to be either mostly
or completely false. The exact same number338were either mostly or completely true.
Nor were any of the panelistsincluding Clift, who at least got the 2008 election rightmuch better
than the others. For each panelist, I calculated a percentage score, essentially reflecting the number of
predictions they got right. Clift and the three other most frequent panelistsBuchanan, the late Tony
Blankley, and McLaughlin himselfeach received almost identical scores ranging from 49 percent to 52
percent, meaning that they were about as likely to get a prediction right as wrong. They displayed about
as much political acumen as a barbershop quartet.
The McLaughlin Group, of course, is more or less explicitly intended as slapstick entertainment for
political junkies. It is a holdover from the shouting match era of programs, such as CNNs Crossfire,
that featured liberals and conservatives endlessly bickering with one another. Our current echo chamber
era isnt much different from the shouting match era, except that the liberals and conservatives are
confined to their own channels, separated in your cable lineup by a demilitarized zone demarcated by
the Food Network or the Golf Channel. This arrangement seems to produce higher ratings if not
necessarily more reliable analysis.
But what about those who are paid for the accuracy and thoroughness of their scholarshiprather than
the volume of their opinions? Are political scientists, or analysts at Washington think tanks, any better at
making predictions?
Are Political Scientists Better Than Pundits?
The disintegration of the Soviet Union and other countries of the Eastern bloc occurred at a remarkably
fast paceand all things considered, in a remarkably orderly way.
On June 12, 1987, Ronald Reagan stood at the Brandenburg Gate and implored Mikhail Gorbachev to
tear down the Berlin Wallan applause line that seemed as audacious as John F. Kennedys pledge to
send a man to the moon. Reagan was prescient; less than two years later, the wall had fallen.
On November 16, 1988, the parliament of the Republic of Estonia, a nation about the size of the
state of Maine, declared its independence from the mighty USSR. Less than three years later, Gorbachev
parried a coup attempt from hard-liners in Moscow and the Soviet flag was lowered for the last time
before the Kremlin; Estonia and the other Soviet Republics would soon become independent nations.
If the fall of the Soviet empire seemed predictable after the fact, however, almost no mainstream
political scientist had seen it coming. The few exceptions were often the subject of ridicule. [Eugene
Lyons, Workers Paradise Lost (New York: Paperback Library, 1967).] If political scientists couldnt
predict the downfall of the Soviet Unionperhaps the most important event in the latter half of the
twentieth centurythen what exactly were they good for?
Philip Tetlock, a professor of psychology and political science, then at the University of California at
Berkeley, was asking some of the same questions. As it happened, he had undertaken an ambitious and
unprecedented experiment at the time of the USSRs collapse. Beginning in 1987, Tetlock started
collecting predictions from a broad array of experts in academia and government on a variety of topics
in domestic politics, economics, and international relations.
Political experts had difficulty anticipating the USSRs collapse, Tetlock found, because a prediction that
not only forecast the regimes demise but also understood the reasons for it required different strands
of argument to be woven together. There was nothing inherently contradictory about these ideas, but
they tended to emanate from people on different sides of the political spectrum, and scholars firmly
entrenched in one ideological camp were unlikely to have embraced them both.
On the one hand, Gorbachev was clearly a major part of the storyhis desire for reform had been
sincere. Had Gorbachev chosen to become an accountant or a poet instead of entering politics, the
Soviet Union might have survived at least a few years longer. Liberals were more likely to hold this
sympathetic view of Gorbachev. Conservatives were less trusting of him, and some regarded his talk of
glasnost as little more than posturing.
Conservatives, on the other hand, were more instinctually critical of communism. They were quicker to
understand that the USSRs economy was failing and that life was becoming increasingly difficult for the
average citizen. As late as 1990, the CIA estimatedquite wronglythat the Soviet Unions GDP was
about half that of the United States (on a per capita basis, tantamount to where stable democracies like
South Korea and Portugal are today). In fact, more recent evidence has found that the Soviet economy
weakened by its long war with Afghanistan and the central governments inattention to a variety of
social problemswas roughly $1 trillion poorer than the CIA had thought and was shrinking by as much
as 5 percent annually, with inflation well into the double digits.
Take these two factors together, and the Soviet Unions collapse is fairly easy to envision. By opening
the countrys media and its markets and giving his citizens greater democratic authority, Gorbachev had
provided his people with the mechanism to catalyze a regime change. And because of the dilapidated
state of the countrys economy, they were happy to take him up on his offer. The center was too weak
to hold: not only were Estonians sick of Russians, but Russians were nearly as sick of Estonians, since the
satellite republics contributed less to the Soviet economy than they received in subsidies from Moscow.
Once the dominoes began falling in Eastern EuropeCzechoslovakia, Poland, Romania, Bulgaria,
Hungary, and East Germany were all in the midst of revolution by the end of 1989there was little
Gorbachev or anyone else could do to prevent them from caving the country in. A lot of Soviet scholars
understood parts of the problem, but few experts had put all the puzzle pieces together, and almost no
one had forecast the USSRs sudden collapse.
Tetlock, inspired by the example of the Soviet Union, began to take surveys of expert opinion in other
areasasking the experts to make predictions about the Gulf War, the Japanese real-estate bubble, the
potential secession of Quebec from Canada, and almost every other major event of the 1980s and
1990s. Was the failure to predict the collapse of the Soviet Union an anomaly, or does expert political
analysis rarely live up to its billing? His studies, which spanned more than fifteen years, were eventually
published in the 2005 book Expert Political Judgment.
Tetlocks conclusion was damning. The experts in his surveyregardless of their occupation, experience,
or subfieldhad done barely any better than random chance, and they had done worse than even
rudimentary statistical methods at predicting future political events. They were grossly overconfident
and terrible at calculating probabilities: about 15 percent of events that they claimed had no
chance of occurring in fact happened, while about 25 percent of those that they said were
absolutely sure things in fact failed to occur. It didnt matter whether the experts were making
predictions about economics, domestic politics, or international affairs; their judgment was equally bad
across the board.
The Right Attitude for Making Better Predictions: Be Foxy
While the experts performance was poor in the aggregate, however, Tetlock found that some had done
better than others. On the losing side were those experts whose predictions were cited most frequently
in the media. The more interviews that an expert had done with the press, Tetlock found, the worse his
predictions tended to be.
Another subgroup of experts had done relatively well, however. Tetlock with his training as a
psychologist, had been interested in the experts cognitive styleshow they thought about the world.
So he administered some questions lifted from personality tests to all the experts.
On the basis of their responses to these questions, Tetlock was able to classify his experts along a
spectrum between what he called hedgehogs and foxes. The reference to hedgehogs and
foxes comes from the title of an Isaiah Berlin essay on the Russian novelist Leo TolstoyThe
Hedgehog and the Fox. Berlin had in turn borrowed his title from a passage attributed to the Greek
poet Archilochus: The fox knows many little things, but the hedgehog knows one big thing.
Unless you are a fan of Tolstoyor of flowery proseyoull have no particular reason to read
Berlins essay. But the basic idea is that writers and thinkers can be divided into two broad categories:
Hedgehogs are type A personalities who believe in Big Ideasin governing
principles about the world that behave as though they were physical laws and undergird virtually every
interaction in society. Think Karl Marx and class struggle, or Sigmund Freud and the unconscious. Or
Malcolm Gladwell and the tipping point.
Foxes, on the other hand, are scrappy creatures who believe in a plethora of little
ideas and in taking a multitude of approaches toward a problem. They tend to be more tolerant of
nuance, uncertainty, complexity, and dissenting opinion. If hedgehogs are hunters, always looking out
for the big kill, then foxes are gatherers.
Foxes, Tetlock found, are considerably better at forecasting than hedgehogs. They had come closer to
the mark on the Soviet Union, for instance. Rather than seeing the USSR in highly ideological termsas
an intrinsically evil empire, or as a relatively successful (and perhaps even admirable) example of a
Marxist economic systemthey instead saw it for what it was: an increasingly dysfunctional nation that
was in danger of coming apart at the seams. Whereas the hedgehogs forecasts were barely any better
than random chance, the foxes demonstrated predictive skill.
How Foxes Think
Multidisciplinary: Incorporate ideas from different disciplines and regardless of their origin on the
political spectrum.
Adaptable: Find a new approachor pursue multiple approaches at the same timeif they arent
sure the original one is working.
Self-critical: Sometimes willing (if rarely happy) to acknowledge mistakes in their predictions and
accept the blame for them.
Tolerant of complexity: See the universe as complicated, perhaps to the point of many
fundamental problems being irresolvable or inherently unpredictable.
Cautious: Express their predictions in probabilistic terms and qualify their opinions.
Empirical: Rely more on observation than theory.
Foxes are better forecasters.
How Hedgehogs Think
Specialized: Often have spent the bulk of their careers on one or two great problems. May view
the opinions of outsiders skeptically.
Stalwart: Stick to the same all-in approachnew data is used to refine the original model.
Stubborn: Mistakes are blamed on bad luck or on idiosyncratic circumstancesa good model had
a bad day.
Order-seeking: Expect that the world will be found to abide by relatively simple governing
relationships once the signal is identified through the noise.
Confident: Rarely hedge their predictions and are reluctant to change them.
Ideological: Expect that solutions to many day-to-day problems are manifestations of some
grander theory or struggle.
Hedgehogs are weaker forecasters.
- pp. 265-269 (RAGE AGAINST THE MACHINES): The father of the modern chess computer was MITs
Claude Shannon, a mathematician regarded as the founder of information theory, who in 1950
published a paper called Programming a Computer for Playing Chess. Shannon identified some of the
algorithms and techniques that form the backbone of chess programs today. He also recognized why
chess is such an interesting problem for testing the powers of information-processing machines.
Chess, Shannon realized, has an exceptionally clear and distinct goalachieving checkmate. Moreover,
it follows a relatively simple set of rules and has no element of chance or randomness. And yet, as
anybody who has played chess has realized (I am not such a good player myself), using those simple
rules to achieve that simple goal is not at all easy. It requires deep concentration to survive more than a
couple of dozen moves into a chess game, let alone to actually win one. Shannon saw chess as a litmus
test for the power of computers and the sort of abilities they might someday possess.
But Shannon, in contrast to some who came after him, did not hold the romanticized notion that
computers might play chess in the same way that humans do. Nor did he see their victory over humans
at chess as being inevitable. Instead, he saw four potential advantages for computers:
1. They are very fast at making calculations.
2. They wont make errors, unless the errors are encoded in the program.
3. They wont get lazy and fail to fully analyze a position or all the possible moves.
4. They wont play emotionally and become overconfident in an apparent winning position
that might be squandered or grow despondent in a difficult one that might be salvaged.
These were to be weighed, Shannon thought, against four distinctly human advantaged:
1. Our minds are flexible, able to shift gears to solve a problem rather than follow a set code.
2. We have the capacity for imagination.
3. We have the ability to reason.
4. We have the ability to learn.
It seemed like a fair fight to Shannon. But that was only the case for a few fleeting moments in
the mid-1990s, when the Russian grandmaster Garry Kasparovthe best chess player of all
timewent up against what was then one of the most advanced computers ever built, IBMs
Deep Blue.
Before their match, humans were winning the fightit wasnt even close. Yet computers have
prevailed ever since, and will continue to do so for as long as we live.
Chess, Prediction, and Heuristics
In accordance with Bayess theorem, prediction is fundamentally a type of information-
processing activitya matter of using new data to test our hypotheses about the objective
world, with the goal of coming to truer and more accurate conceptions about it.
Chess might be thought of as analogous to prediction. The players must process information
the position of the thirty-two pieces on the board and their possible moves. They use this
information to devise strategies to place their opponent in checkmate. These strategies in
essence represent different hypotheses about how to win the game. Whoever succeeds in that
task had the better hypothesis.
Chess is deterministicthere is no real element of luck involved. But the same is theoretically
true of the weather . . . Our knowledge of both systems is subject to considerable imperfections.
In weather, much of the problem is that our knowledge of the initial conditions is incomplete.
Even though we have a very good idea of the rules by which the weather system behaves, we
have incomplete information about the position of all the molecules that form clouds and
rainstorms and hurricanes. Hence, the best we can do is make probabilistic forecasts.
In chess, we have both complete knowledge of the governing rules and perfect
informationthere are a finite number of chess pieces, and theyre right there in plain sight. But
the game is still very difficult for us. Chess speaks to the constraints on our information-
processing capabilitiesand it might tell us something about the best strategies for making
decisions despite them. The need for prediction arises not necessarily because the world itself is
uncertain, but because understanding it fully is beyond our capacity.
Both computer programs and human chess masters therefore rely on making simplifications to
forecast the outcome of the game. We can think of these simplifications to forecast the
outcome of the game. We can think of these simplifications as models, but heuristics is
the preferred term in the study of computer programming and human decision making. It comes
from the same Greek root word from which we derive eureka. A heuristic approach to
problem solving consists of employing rules of thumb when a deterministic solution to a
problem is beyond our practical capacities.
Heuristics are very useful things, but they necessarily produce biases and blind spots. For
instance, the heuristic When you encounter a dangerous animal, run away! is often a useful
guide but not when you meet a grizzly bear; she may be startled by your sudden movement and
she can easily outrun you. (Instead, the National Park Service advises you to remain as quiet and
as still as possible when you encounter a grizzly bear and even to play dead if necessary.)*
Humans and computers apply different heuristics when they play chess. When they play against
each other, the game usually comes down to who can find his opponents blind spots first.
* Lauren Himiak, Bear Safety Tips, National & State Parks, About.com. http://usparks.about.com/od/backcoun...ear-Safety.htm
Kasparovs Failed Prediction
In January 1988, Garry Kasparov, the top-rated chess player in the world from 1986 until his
retirement in 2005, predicted that no computer program would be able to defeat a human
grandmaster at chess until at least the year 2000. If any grandmaster has difficulties playing
computers, he quipped at a press conference in Paris, I would be happy to provide my advice.
Later that same year, however, the Danish grandmaster Bent Larsen was defeated by a program
named Deep Thought, a graduate-school project by several students at Carnegie Mellon
University.
The garden-variety grandmaster, however, was no Kasparov, and when Deep Thought squared
off against Kasparov in 1989 it was resoundingly defeated. Kasparov has always respected the
role of computing technology in chess, and had long studied with computers to improve his
game, but he offered Deep Thought only the faintest praise, suggesting that one day a computer
could come along that might require him to exert his 100 percent capabilities in order to
defeat it.
The programmers behind Deep Thought, led by Feng-hsiung Hsu and Murray Campbell, were
eventually hired by IBM, where their system evolved into Deep Blue. Deep Blue did defeat
Kasparov in the first game of a match in Philadelphia in 1996, but Kasparov rebounded to claim
the rest of the series fairly easily. It was the next year, in a rematch in New York, when the
unthinkable happened. Garry Kasparov, the best and most intimidating chess player in history,
was intimidated by a computer.
In the Beginning . . .
A chess game, like everything else, has three parts: the beginning, the middle and the end.
Whats a little different about chess is that each of these phases tests different intellectual and
emotional skills, making the game a mental triathlon of speed, strength, and stamina.
In the beginning of a chess game the center of the board is void, with pawns, rooks, and
bishops neatly aligned in the first two rows awaiting instructions from their masters. The
possibilities are almost infinite. White can open the game in any of twenty different ways, and
black can respond with twenty of its own moves, creating 4,000 possible sequences after the
first full turn. After the second full turn, there are 71,852 possibilities; after the third, there are
9,132,484. The number of possibilities in an entire chess game, played to completion, is so large
that it is a significant problem even to estimate it, but some mathematicians put the number as
high as [ten to the power of ten to the power of fifty]. These are astronomical numbers: as
Diego Rasskin-Gutman has written, There are more possible chess games than the number of
atoms in the universe. [Garry Kasparov, The Chess Master and the Computer, New York
Review of Books, February 11, 2010.
http://www.nybooks.com/articles/arch...-the-computer/
- pp. 276-279 (The Beginning of the End): In the final stage of a chess game, the endgame,
the number of pieces on the board are fewer, and winning combinations are sometimes more
explicitly calculable. Still, this phase of the game necessitates a lot of precision, since closing out
a narrowly winning position often requires dozens of moves to be executed properly without
any mistakes . . . .
The endgame can be a mixed blessing for computers. There are few intermediate tactical goals
left, and unless a computer can literally solve the position to the bitter end, it may lose the
forest for the trees. However, just as chess computers have databases to cover the opening
moves, they also have databases of these endgame scenarios. Literally all positions in which
there are six or fewer pieces on the board have been solved to completion. Work on seven-
piece positions is mostly complete some of the solutions are intricate enough to require as
many as 517 moves but computers have memorized exactly which are the winning, losing, and
drawing ones.
Thus, something analogous to a black hole has emerged by this stage of the game: a point
beyond which the gravity of the game tree becomes inescapable, when the computer will draw
all positions that should be drawn and win all of them that should be won. The abstract goals of
this autumnal phase of a chess game are replaced by a set of concrete ones: get your queenside
pawn to here, and you will win; induce black to move his rook there, and you will
draw.
Deep Blue, then, had some incentive to play on against Kasparov in Game 1. Its circuits told it
that its position was a losing one, but even great players like Kasparov make serious blunders
about once per seventy-five moves. One false step by Kasparov might have been enough to
trigger Deep Blues sensors and allow it to find a drawing position. Its situation was desperate,
but not quite hopeless.
Instead, Deep Blue did something very strange, at least to Kasparovs eyes. On its forty-fourth
turn, Deep Blue moved one of its rooks into whites first row rather than into a more
conventional position that would have placed Kasparovs king into check. The computers move
seemed completely pointless. At a moment when it was under assault from every direction, it
had essentially passed its turn, allowing Kasparov to advance one of his pawns into blacks
second row, where it threatened to be promoted to a queen. Even more strangely, Deep Blue
resigned the game just one turn later.
What had the computer been thinking? Kasparov wondered. He was used to seeing Deep
Blue commit strategic blundersfor example, accepting the bishop-rook exchangein complex
positions where it simply couldnt think deeply enough to recognize the implications. But this
had been something different: a tactical error in a relatively simple positionexactly the
sort of mistake that computers dont make.
How can a computer commit suicide like that? Kasparov asked Frederic Friedel, a German
chess journalist who doubled as his friend and computer expert, when they studied the match
back at the Plaza Hotel that night. There were some plausible explanations, none of which
especially pleased Kasparov. Perhaps Deep Blue had indeed committed suicide, figuring that
since it was bound to lose anyway, it would rather not reveal any more to Kasparov about how it
played. Or perhaps, Kasparov wondered, it was part of some kind of elaborate hustle? Maybe
the programmers were sandbagging, hoping to make the hubristic Kasparov overconfident by
throwing the first game?
Kasparov did what came most naturally to him when he got anxious and began to pore through
the data. With the assistance of Friedel and the computer program Fritz, he found that the
conventional playblack moving its rook into the sixth column and checking whites king
wasnt such a good move for Deep Blue after all: it would ultimately lead to a checkmate for
Kasparov, although it would still take more than twenty moves for him to complete it.
But what this implied was downright frightening. The only way the computer would pass on a
line that would have required Kasparov to spend twenty moves to complete his checkmate, he
reasoned, is if it had found another one that would take him longer. As Friedel recalled:
Deep Blue had actually worked it all out, down to the very end and simply chosen the least
obnoxious losing line. It probably saw mates in 20 and more, said Garry, thankful that he had
been on the right side of these awesome calculations.
To see twenty moves ahead in a game as complex as chess was once thought to be impossible
for both human beings and computers. Kasparovs proudest moment, he once claimed, had
come in a match in the Netherlands in 1999, when he had visualized a winning position some
fifteen moves in advance. Deep Blue was thought to be limited to a range of six to eight moves
ahead in most cases. Kasparov and Friedel were not exactly sure what was going on, but what
had seemed to casual observers like a random and inexplicable blunder instead seemed to them
to reveal great wisdom.
Kasparov would never defeat Deep Blue again.
- pp. 282-283: Kasparov resolved that he wouldnt be able to beat Deep Blue by playing the forceful,
intimidating style of chess that made him World Champion. Instead, he would have to try to trick the
computer with a cautious and unconventional style, in essence playing the role of the hacker who prods
a program for vulnerabilities. But Kasparovs opening move in the third game, while unusual enough to
knock Deep Blue out of its databases, was too inferior to yield anything better than a draw. Kasparov
played better in the fourth and fifth games, seeming to have the advantage at points in both of them,
but couldnt overcome the gravity of Deep Blues endgame databases and drew both of them as well.
The match was square at one win for each player and three ties, with one final game to play.
On the day of the final game, Kasparov showed up at the Equitable Center looking tired and
forlorn; Friedel later recalled that he had never seen him in such a dark mood. Playing the black pieces,
Kasparov opted for something called the Caro-Kann Defense. The Caro-Kann is considered somewhat
weakblacks winning percentage with it is 44.7 percent historicallyalthough far from irredeemable
for a player like Karpov who knows it well. But Kasparov did not know the Caro-Kann; he had rarely
played it in tournament competition. After just a few moves, he was straining, taking a long time to
make decisions that were considered fairly routine. And on his seventh move, he committed a grievous
blunder, offering a knight sacrifice one move too early. Kasparov recognized his mistake almost
immediately, slumping down in his chair and doing nothing to conceal his displeasure. Just twelve moves
laterbarely an hour into the gamehe resigned, storming away from the table.
Deep Blue had won. Only, it had done so less with a bang than an anticlimactic whimper. Was Kasparov
simply exhausted, exacerbating his problems by playing an opening line with which he had little
familiarity? Or, as the grandmaster Patrick Wolff concluded, had Kasparov thrown the game, to
delegitimize Deep Blues accomplishment? Was there any significance to the fact that the line he had
selected, the Caro-Kann, was a signature of Karpov, the rival whom he had so often vanquished?
But these subtleties were soon lost to the popular imagination. Machine had triumphed over man! It
was like when HAL 9000 took over the spaceship. Like the moment when, exactly thirteen seconds into
Love Will Tear Us Apart, the synthesizer overpowers the guitar riff, leaving rock and roll in its dust.
[This metaphor is borrowed from Bill Wyman, a music critic for the Chicago Reader, who ranked it as the
greatest moment in rock history. Bill Wyman, The 100 Greatest Moments in Rock History, Chicago
Reader, September 28, 1995. http://www.chicagoreader.com/chicago...ent?oid=888578
- pp. 204-209 [Chapter 7 (Role Models)]: The flu hit Fort Dix like clockwork every January; it had almost
become a rite of passage. Most of the soldiers would go home for Christmas each year, fanning out to all
corners of the United States for their winter break. They would then return to the base, well-fed and
well-rested, but also carrying whichever viruses might have been going around their hometowns. If the
flu was anywhere in the country, it was probably coming back with them. Life in the cramped setting of
the barracks, meanwhile, offered few opportunities for privacy or withdrawal. If someoneanyone
had caught the flu back home, he was more likely than not to spread it to the rest of the platoon. You
could scarcely conjure a scenario more favorable to transmission of the disease.
Usually this was no cause for concern; tens of millions of Americans catch the flu in January and
February every year. Few of them die from it, and young, healthy men like David Lewis, a nineteen-year-
old private from West Ashley, Massachusetts, who had returned to Fort Dix that January, are rarely
among the exceptions. So Lewis, even though hed been sicker than most of the recruits and ordered to
stay in the barracks, decided to join his fellow privates on a fifty-mile march through the snow-
blanketed marshlands of central New Jersey. He was in no mood to let a little fever bother himit was
1976, the year of the nations bicentennial, and the country needed order and discipline in the uncertain
days following Watergate and Vietnam.
But Lewis never made it back to the barracks: thirteen miles into the march, he collapsed and was later
pronounced dead. An autopsy revealed that Lewiss lungs were flush with blood: he had died of
pneumonia, a common complication of flu, but not usually one to kill a healthy young adult like Lewis.
The medics at Fort Dix had already been nervous about that years flu bug. Although some of
the several hundred soldiers who had gotten ill that winter had tested positive for the A/Victoria flu
strainthe name for the common and fairly benign virus that was going around the world that year
there were others like Lewis who had suffered from an unidentified and apparently much more severe
type of flu. Samples of their blood were sent to the Center for Disease Control (CDC) in Atlanta for
further testing.
Two weeks later the CDC revealed the identity of the mysterious virus. It was not a new type of flu after
all but instead something altogether more disturbing, a ghost from epidemics past: influenza virus type
H1N1, more commonly known as the swine flu. H1N1 had been responsible for the worst pandemic in
modern history: the Spanish flu of 1918-20, which afflicted a third of humanity and killed 50 million,
including 675,000 in the United States. For reasons of both science and superstition, the disclosure sent
a chill through the nations epidemiological community. The 1918 outbreaks earliest manifestations had
also come at a military base, Fort Riley in Kansas, where soldiers were busy preparing to enter World
War I. Moreover, there was a belief at that timebased on somewhat flimsy scientific evidencethat a
major flu epidemic manifested itself roughly once every ten years. The flu had been severe in 1938,
1947, 1957, and 1968; in 1976, the world seemed due for the next major pandemic.
A series of dire predictions soon followed. The concern was not an immediate outbreakby the time
the CDC had positively identified the H1N1 strain, flu season had already run its course. But scientists
feared that it foreshadowed something much worse the following winter. There had never been a case,
a prominent doctor noted to the New York Times, in which a newly identified strain of the flu had
failed to outcompete its rivals and become the global hegemon: wimpy A/Victoria stood no chance
against its more virulent and ingenious rival. And if H1N1 were anywhere near as deadly as the 1918
version had been, the consequences might be very bad indeed. Gerald Fords secretary of health, F.
David Mathews, predicted that one million Americans would die, eclipsing the 1918 total.
President Ford found himself in a predicament. The vaccine industry, somewhat like the fashion
industry, needs at least six months of lead time to know what the hip vaccine is for the new season; the
formula changes a little bit every year. If they suddenly had to produce a vaccine that guarded against
H1N1and particularly if they were going to produce enough of it for the entire nationthey would
need to get started immediately. Meanwhile, Ford was struggling to overcome a public perception that
he was slow-witted and unsure of himselfan impression that grew more entrenched every weekend
with Chevy Chases bumbling-and-stumbling caricature of him on NBCs new hit show, Saturday Night
Live. So Ford took the resolute step of asking Congress to authorize some 200 million doses of
vaccine, and ordered a mass vaccination program, the first the country had seen since Jonas Salk had
developed the polio vaccine in the 1950s.
The press portrayed the mass vaccination program as a gamble. But Ford thought of it as a gamble
between money and lives, and one that he was on the right side of. Overwhelming majorities in both
houses of Congress approved his plans at a cost of $180 million.
By summer, however, there were serious doubts about the governments plans. Although summer is the
natural low season for the flu in the United States, it was winter in the Southern Hemisphere, when flu is
normally at its peak. And nowhere, from Auckland to Argentina, were there any signs of H1N1; instead,
the mild and common A/Victoria was the dominant strain again. Indeed, the roughly two hundred cases
at Fort Dix remained the only confirmed cases of H1N1 anywhere in the world, and Private Lewiss the
only death. criticism started to pour in from all quarters: from the assistant director of the CDC, the
World Health Organization, the prestigious British medical journal The Lancet, and the editorial
pages of the New York Times, which was already characterizing the H1N1 threat a false alarm. No
other Western country had called for such drastic measures.
Instead of admitting that they had overestimated the threat, the Ford administration doubled down,
preparing a series of frightening public service announcements that ran in regular rotation on the
nations television screens that fall. One mocked the naïveté of those who refused flu shotsIm the
healthiest fifty-five-year-old youve ever seenI play golf every weekend! the balding everyman
says, only to be shown on his deathbed moments later. Another featured a female narrator tracing the
spread of the virus from one person to the next, dishing about it in breathy tones as though it were an
STDBettys mother gave it to the cabdriver . . . and to one of the charming stewardesses . . . and
then she gave it to her friend Dottie, who had a heart condition and died.
The campy commercials were intended to send a very serious message: Be afraid, be very afraid.
Americans took the hint. Their fear, however, manifested itself as much toward the vaccine as toward
the disease itself. Throughout American history, the notion of the government poking needles into
everyones arm has always provoked more than its fair share of anxiety. But this time there was a more
tangible basis for public doubt. In August of that year, under pressure from the drug companies,
Congress and the White House had agreed to indemnify them from legal liability in the event of
manufacturing defects. This was widely read as a vote of no-confidence; the vaccine looked as though it
was being rushed out without adequate time for testing. Polls that summer showed that only about 50
percent of Americans planned to get vaccinated, far short of the governments 80 percent goal.
The uproar did not hit a fever pitch until October, when the vaccination program began. On
October 11, a report surfaced from Pittsburgh that three senior citizens had died shortly after receiving
their flu shots; so had two elderly persons in Oklahoma City; so had another in Fort Lauderdale. There
was no evidence that any of the deaths were linked to the vaccinationselderly people die every day,
after all. But between the anxiety about the governments vaccination program and the medias dubious
understanding of statistics, every death of someone whod gotten a flu shot became a cause for alarm.
Even Walter Cronkite, the most trusted man in Americawho had broken from his trademark austerity
to admonish the media for its sensational handling of the storycould not calm the public down.
Pittsburgh and many other cities shuttered their clinics.
By late fall, another problem had emerged, this one far more serious. About five hundred patients, after
receiving their shots, had begun to exhibit the symptoms of a rare neurological condition known as
Guillain-Barre syndrome, an autoimmune disorder that can cause paralysis. This time, the statistical
evidence was far more convincing: the usual incidence of Guillain-Barre in the general population is only
about one case per million persons. In contrast, the rate in the vaccinated population had been ten
times thatfive hundred cases out of the roughly fifty million people who had been administered the
vaccine. Although scientists werent positive why the vaccines were causing Guillain-Barre,
manufacturing defects triggered by the rush production schedule were a plausible culprit, and the
consensus of the medical community was that the vaccine program should be shut down for good,
which the government finally did on December 16.
In the end, the outbreak of H1N1 at Fort Dix had been completely isolated; there was never another
confirmed case anywhere in the country. Meanwhile, flu deaths from the ordinary A/Victoria strain were
slightly below average in the winter of 1976-77. It had been much ado about nothing.
The swine flu fiascoas it was soon dubbedwas a disaster on every level for President Ford, who lost
his bid for another term to the Democrat Jimmy Carter that November. The drug makers had been
absolved of any legal responsibility, leaving more than $2.6 billion in liability claims against the United
States government. It seemed like every local paper had run a story about the poor waitress or
schoolteacher who had done her duty and gotten the vaccine, only to have contracted Guillain-Barre . . .
Fords handling of H1N1 was irresponsible on a number of levels. By invoking the likelihood of a
1918-type pandemic, he had gone against the advice of medical experts, who believed at the time that
the chance of such a worst-case outcome was no higher than 35 percent and perhaps as low as 2
percent.
Still, it was not clear what had caused H1N1 to disappear just as suddenly as it emerged. And predictions
about H1N1 would fare little better when it came back some thirty-three years later. Scientists at first
missed H1N1 when it reappeared in 2009. Then they substantially overestimated the threat it might
pose once they detected it.
- pp. 371-380 [A CLIMATE OF HEALTHY SKEPTICISM (The Noise and the Signal)]: Many of the examples in
this book concerns cases where forecasters mistake correlation for causation and noise for a signal. Up
until about 1997, the conference of the winning Super Bowl team had been very strongly correlated
with the direction of the stock market over the course of the next year. However, there was no
credible causal mechanism behind the relationship, and if you had made investments on that basis
you would have lost your shirt. The Super Bowl indicator was a false positive.
The reverse can sometimes also be true. Noisy data can obscure the signal, even when there is
essentially no doubt that the signal exists. Take a relationship that few of us would dispute: if you
consume more calories, you are more likely to become fat. Surely such a basic relationship would show
up clearly in the statistical record?
I downloaded data from eighty-four countries for which estimates of both obesity rates and daily
caloric consumption are publicly available. Looked at in this way, the relationship seems surprisingly
tenuous. The daily consumption in South Korea, which has a fairly meat-heavy diet, is about 3,070
calories per person per day, slightly above the world average. However, the obesity rate there is only
about 3 percent. The Pacific island nation of Nauru, by contrast, consumes about as many calories as
South Korea per day, but the obesity rate there is 79 percent. If you plot the eighty-four countries on a
graph . . . there seems to be only limited evidence of a connection between obesity and calorie
consumption; it would not qualify as statistically significant by standard tests.*
There are, of course, many conflating factors that obscure the relationship. Certain countries have
better genetics, or better exercise habits. And the data is rough: estimating how many calories an adult
consumes in a day is challenging. [One common technique requires adults to dutifully record everything
they eat over a period of weeks, and trusts them to do so honestly when there is a stigma attached to
overeating (and more so in some countries than others).] A researcher who took this statistical
evidence too literally might incorrectly reject the connection between calorie consumption and
obesity, a false negative.
* As I discuss in chapter 6, the concept of statistical significance is very often problematic in practice.
But to my knowledge there does not exist a community of obesity skeptics who cite statistics like
these to justify a diet of Big Macs and Fritos.
It would be nice if we could just plug data into a statistical model, crunch the numbers, and take for
granted that it was a good representation of the real world. Under some conditions, especially in
data-rich fields like baseball, that assumption is fairly close to being correct. In many other cases, a
failure to think carefully about causality will lead us up blind alleys.
There would be much reason to doubt claims about global warming were it not for their grounding in
causality. The earths climate goes through various warm and cold phases that play out over periods of
years or decades or centuries. These cycles long predate the dawn of industrial civilization.
However, predictions are potentially much stronger when backed up by a sound understanding of the
root causes behind a phenomenon. We do have a good understanding of the cause of global warming: it
is the greenhouse effect.
The Greenhouse Effect Is Here
In 1990, two years after Hansens hearing, the United Nations International Panel on Climate Change
(IPCC) released more than a thousand pages of findings about the science of climate change in its First
Assessment Report. Produced over several years by a team of hundreds of scientists from around the
globe, the report went into voluminous detail on the potential changes in temperatures and
ecosystems, and outlines a variety of strategies to mitigate these effects.
The IPCCs scientists classified just two findings as being absolutely certain, however. These findings did
not rely on complex models, and they did not make highly specific predictions about the climate.
Instead, they were based on relatively simple science that had been well-understood for more than 150
years and which is rarely debated even by self-described climate skeptics. They remain the most
important scientific conclusions about climate change today.
The IPCCs first conclusion was simply that the greenhouse effect exists:
There is a natural greenhouse effect that keeps the Earth warmer than it otherwise would be. [J. T.
Houghton, G. J. Jenkins, and J. J. Ephraums, Report Prepared for Intergovernmental Panel on Climate
Change by Working Group I, Climate Change: The IPCC Scientific Assessment (Cambridge:
Cambridge University Press, 1990), p. XI.]
The greenhouse effect is the process by which certain atmospheric gasesprincipally water vapor,
carbon dioxide (CO2), methane, and ozoneabsorb solar energy that has been reflected from the
earths surface. Were it not for this process, about 30 percent of the suns energy would be reflected
back out into space in the form of infrared radiation. That would leave the earths temperatures much
colder than they actually are: about 0 [degrees] Fahrenheit or -18 [degrees] Celsius on average, or the
same as a warm day on Mars.
Conversely, if these gases become more plentiful in the atmosphere, a higher fraction of the suns
energy will be trapped and reflected back onto the surface, making temperatures much warmer. On
Venus, which has a much thicker atmosphere consisting almost entirely of carbon dioxide, the average
temperature is 460 [degrees Celsius]. Some of that heat comes from Venuss proximity to the sun, but
much of it is because of the greenhouse effect.
There is no scenario in the foreseeable future under which the earths climate will come to resemble
that of Venus. However, the climate is fairly sensitive to changes in atmospheric composition, and
human civilization thrives within a relatively narrow band of temperatures. The coldest world capital is
Ulan Bator, Mongolia, where temperatures average about -1 [degrees Celsius] (or +30 [degrees
Fahrenheit]) over the course of the year; the warmest is probably Kuwait City, Kuwait, where they
average +27 [degrees Celsius] (+81 [degrees Fahrenheit]). Temperatures can be hotter or cooler
during winter or summer or in sparsely populated areas, but the temperature extremes are modest on
an interplanetary scale. On Mercury, by contrast, which has little atmosphere to protect it,
temperatures often vary between about -200 [degrees Celsius] and +400 [degrees Celsius] over the
course of a single day.
The IPCCs second conclusion made an elementary prediction based on the greenhouse effect: as the
concentration of greenhouse gases increased in the atmosphere, the greenhouse effect and global
temperatures would increase along with them:
Emissions resulting from human activities are substantially increasing the atmospheric concentrations
of the greenhouse gases carbon dioxide, methane, chlorofluorocarbons (CFCs) and nitrous oxide. These
increases will enhance the greenhouse effect, resulting on average in additional warming of the Earths
surface. The main greenhouse gas, water vapor, will increase in response to global warming and
further enhance it.
This IPCC finding makes several different assertions, each of which is worth considering in turn.
First, it claims that atmospheric concentrations of greenhouse gases like CO2 are increasing, and
as a result of human activity. This is a matter of simple observation. Many industrial processes,
particularly the use of fossil fuels, produce CO2 as a by-product.* Because CO2 remains in the
atmosphere for a long time, its concentrations have been rising: from about 315 parts per million
(ppm) when CO2 levels were first directly monitored at the Muana Loa Observatory in Hawaii in
1959 to about 390 PPM as of 2011. [Full Mauna Loa CO2 Record in Trends in Atmospheric Carbon
Dioxide, Earth System Research Laboratory, National Oceanic & Atmospheric Administration
Research, U.S. Department of Commerce. http://www.esrl.noaa.gov/gmd/ccgg/trends/#mlo_full
* Human-Related Sources and Sinks of Carbon Dioxide in Climate ChangeGreenhouse Gas
Emissions, Environmental Protection Agency. http://www.epa.gov/climatechange/emi...co2_human.html
The second claim, these increases will enhance the greenhouse effect, resulting on average in
additional warming of the Earths surface, is essentially just a restatement of the IPCCs first
conclusion that the greenhouse effect exists, phrased in the form of a prediction. The prediction relies
on relatively simple chemical reactions that were identified in laboratory experiments many years ago.
The greenhouse effect was first proposed by the French physicist Joseph Fourier in 1824 and is usually
regarded as having been proved by the Irish physicist John Tyndall in 1859, the same year that Charles
Darwin published On the Origin of the Species. [Isaac M. Held and Brian J. Soden, Water Vapor
Feedback and Global Warming, Annual Review of Energy and the Environment, 25 (November
2000), pp. 441-475. http://www.annualreviews.org/doi/abs...nergy.25.1.441
The third claimthat water vapor will also increase along with gases like CO2, thereby
enhancing the greenhouse effectis modestly bolder. Water vapor, not CO2, is the largest contributor
to the greenhouse effect. If there were an increase in CO2 alone, there would still be some warming, but
not as much as has been observed to date or as much as scientists predict going forward. But a basic
thermodynamic principle known as the Clausius-Clapeyron relation, which was proposed and proved in
the nineteenth century, holds that the atmosphere can retain more water vapor at warmer
temperatures. Thus, as CO2 and other long-lived greenhouse gases increase in concentration and
warm the atmosphere, the amount of water vapor will increase as well, multiplying the effects of CO2
and enhancing warming.
This Isnt Rocket Science
Scientists require a high burden of proof before they are willing to conclude that a hypothesis is
incontrovertible. The greenhouse hypothesis has met this standard, which is why the original IPCC
report singled it out from among hundreds of findings as the only thing that scientists were absolutely
certain about. The science behind the greenhouse effect was simple enough to have been widely
understood by the mid- to late nineteenth century, when the light-bulb and the telephone and the
automobile were being inventedand not the atomic bomb or the iPhone or the Space Shuttle. The
greenhouse effect isnt rocket science.
Indeed, predictions that industrial activity would eventually trigger global warming were made long
before the IPCCas early as 1897* by the Swedish chemist Svante Arrhenius, and at many other times
before the warming signal produced by the greenhouse signal had become clear enough to be
distinguished from natural causes. [J. H. Mercer, West Antarctic Ice Sheet and CO2 Greenhouse Effect:
A Threat of Disaster, Nature, 271 (January 1978), pp. 321-325. http://stuff.mit.edu/~heimbach/paper..._1978_wais.pdf
* Kerry A. Emanuel, Advance Written Testimony, Hearing on Climate Change: Examining the Processes
Used to Create Science and Policy, House Committee on Science, Space and Technology, U.S. House of
Representatives, March 31, 2011. http://science.house.gov/sites/repub...0testimony.pdf
It now seems almost quaint to refer to the greenhouse effect. In the mid-1980s, the term greenhouse
effect was about five times more common in English-language books than the phrase global
warming. But usage of greenhouse effect peaked in the early 1990s and has been in steady
decline since. It is now used only about one-sixth as often as the term global warming, and one-tenth as
often as the broader term climate change.
This change has largely been initiated by climate scientists* as they seek to expand the predictive
implications of the theory. However, the pullback from speaking about the causes of the
changethe greenhouse effectyields predictably misinformed beliefs about it. [In this sense,
the term climate change may be inferior to the more specific term global warming.
Climate change creates the impression that any potential change in our environment
warming or cooling, more precipitation or lessis potentially consistent with the theory. In fact,
some of these phenomena (like cooler temperatures) would contradict the predictions made by the
theory under most circumstances.]
* Erik Conway, Whats in a Name? Global Warming vs. Climate Change, NASA.gov.
http://www.nasa.gov/topics/earth/fea...ther_name.html
In January 2012, for instance, the Wall Street Journal published an editorial entitled No Need to
Panic About Global Warming, which was signed by a set of sixteen scientists and advocates who might
be considered global warming skeptics. Accompanying the editorial was a video produced by the Wall
Street Journal that was captioned with the following phrase:
A large number of scientists dont believe that carbon dioxide is causing global warming. [No Need
to Panic About Global Warming; Wall Street Journal, January 26, 2012.
http://online.wsj.com/article/SB1000...pinion_LEADTop
In fact, very few scientists doubt thisthere is essentially no debate that greenhouse gases cause global
warming. Among the believers in the theory was the physics professor William Happer of Princeton,
who cosigned the editorial and who was interviewed for the video. Most people like me believe that
industrial emissions will cause warming, Happer said about two minutes into the video. Happer takes
issue with some of the predictions of global warmings effects, but not with its cause.
I do not mean to suggest that you should just blindly accept a theory in the face of contradictory
evidence. A theory is tested by means of its predictions, and the predictions made by climate scientists
have gotten some things right and some things wrong. Temperature data is quite noisy. A warming
trend might validate the greenhouse hypothesis or it might be caused by cyclical factors. A
cessation in warming could undermine the theory or it might represent a case where the noise in
the data had obscured the signal.
But even if you believe, as Bayesian reasoning would have it, that almost all scientific hypotheses
should be thought of probabilistically, we should have a greater degree of confidence in a hypothesis
backed up by strong and clear causal relationships. Newly discovered evidence that seems to militate
against the theory should nevertheless lower our estimate of its likelihood, but it should be weighed in
the context of the other things we know (or think we do) about the planet and its climate.
Healthy skepticism needs to proceed from this basis. It needs to weigh the strength of new evidence
against the overall strength of the theory, rather than rummaging through fact and theory alike for
argumentative and ideological convenience, as is the cynical practice when debates become
partisan and politicized.
Three Types of Climate Skepticism
It is hard to imagine a worse time and place to hold a global climate conference than Copenhagen in
December, as the United Nations did in 2009. During the winter solstice there, the days are short and
darkperhaps four hours of decent sunlightand the temperatures are cold, with the wind whipping
off the Oresund, the narrow strait that separates Denmark from Sweden.
Worst yet, the beer is expensive: the high taxes on alcohol and pretty much everything else in
Denmark help to pay for a green-technology infrastructure that rivals almost anywhere in the world.
Denmark consumes no more energy today than it did in the late 1960s,* in part because it is
environmentally friendly and in part because of its low population growth. (By contrast, the
United States energy consumption has roughly doubled over the same period.) [United States
Energy Use (kt of oil equivalent), World Bank data via Google Public Data, last updated March 30, 2012.
http://www.google.com/publicdata/exp...on&hl=en&dl=en
* Denmark Energy Use (kt of oil equivalent), World Bank data via Google Public Data, last updated
March 30, 2012.
http://www.google.com/publicdata/exp...on&hl=en&dl=en
The implicit message seemed to be that an energy-efficient future would be cold, dark and expensive.
It is little wonder, then, that the mood at Copenhagens Bella Center ranged far beyond
skepticism and toward outright cynicism. I had gone to the conference, somewhat naively, seeking a
rigorous scientific debate about global warming. What I found instead was politics, and the differences
seemed irreconcilable.
Delegates from Tuvalu, a tiny, low-lying Pacific island nation that would be among the most vulnerable
to rising sea levels, roamed the halls, loudly protesting what they thought to be woefully inadequate
targets for greenhouse-gas reduction. Meanwhile, the large nations that account for the vast majority of
greenhouse-gas emissions were nowhere near agreement.
President Obama had arrived at the conference empty-handed, having burned much of his political
capital on his health-care bill and his stimulus package. Countries like China, India, and Brazil, which are
more vulnerable than the United States to climate change impacts because of their geography but are
reluctant to adopt commitments that might impair their economic growth, werent quite sure where to
stand. Russia, with its cold climate and its abundance of fossil-fuel resources, was a wild card. Canada,
also cold and energy-abundant, was another, unlikely to push for any deal that the United States lacked
the willpower to enact.* There was some semblance of a coalition among some of the wealthier nations
in Europe, along with Australia, Japan, and many of the worlds poorer countries in Africa and the
Pacific.** But global warming is a problem wherein even if the politics are local, the science is not. CO2
quickly circulates around the planet: emissions from a diesel truck in Qingdao will eventually affect the
climate in Quito. Emissions-reductions targets therefore require near-unanimity, and not mere
coalition-building, in order to be enacted successfully. That agreement seemed years if not decades
away.
* FAQ: Copenhagen Conference 2009; CBCNews.ca, December 8, 2009.
http://www.cbc.ca/news/world/story/2...en-summit.html
** Nate Silver, Despite Protests, Some Reason for Optimism in Copenhagen, FiveThirtyEight.com,
December 9, 2009.
http://www.fivethirtyeight.com/2009/...asons-for.html
I was able to speak with a few scientists at the conference. One of them was Richard Rood, a
soft-spoken North Carolinian who once led teams of scientists at NASA and who now teaches a course
on climate policy to students at the University of Michigan.
At NASA, I finally realized that the definition of rocket science is using relatively simple physics to solve
complex problems, Rood told me. The science part is relatively easy. The other partshow do you
develop policy, how do you respond in terms of public healththese are all relatively difficult
problems because they dont have as well defined a cause-and-effect mechanism.
As I was speaking with rood, we were periodically interrupted by announcements from the Bella
Centers loudspeaker. No consensus was found. Therefore I suspend this agenda item, said a
French-sounding woman, mustering her best English. But Rood articulated the three types of
skepticism that are pervasive in the debate about the future of climate.
One type of skepticism flows from self-interest. In 2011 alone, the fossil fuel industry spent about $300
million on lobbying activities (roughly double what theyd spent just five years earlier).* Some climate
scientists I later spoke with for this chapter used conspiratorial language to describe their activities. But
there is no reason to allege a conspiracy when an explanation based on rational self-interest will suffice:
these companies have a financial incentive to preserve their position in the status quo, and they are
within their First Amendment rights to defend it. What they say should not be mistaken for an attempt
to make accurate predictions, however.
A second type of skepticism falls into the category of contrarianism. In any contentious debate, some
people will find it advantageous to align themselves with the crowd, while a smaller number will come
to see themselves as persecuted outsiders. This may especially hold in a field like climate science, where
the data is noisy and the predictions are hard to experience in a visceral way. And it may be especially
common in the United States, which is admirably independent-minded. If you look at climate, if you
look at ozone, if you look at cigarette smoking, there is always a community of people who are skeptical
of the science-driven results, Rood told me.
Most importantly, there is scientific skepticism. Youll find that some in the scientific community have
valid concerns about one aspect of the science or the other, Rood said. At some level, if you really
want to move forward, we need to respect some of their points of view.
* Energy/Natural Resources: Lobbying, 2011, OpenSecrets.org.
http://www.opensecrets.org/industrie...ying.php?ind=E
- pp. 382-385 (All the Climate Scientists Agree on Some of the Findings): There is an unhealthy obsession
with the term consensus as it is applied to global warming. Some who dissent from what they see
as the consensus view are proud to acknowledge it and label themselves as heretics.* Others, however,
have sought strength in numbers, sometimes resorting to dubious techniques like circulating online
petitions in an effort to demonstrate how much doubt there is about the theory. [One such petition,
which was claimed to have been signed by 15,000 scientists, later turned up names like Geri Halliwell,
a.k.a Ginger Spice of the Spice Girls, who had apparently given up her career as a pop star to pursue a
degree in microbiology.] Meanwhile, whenever any climate scientist publicly disagrees with any finding
about global warming, they may claim that this demonstrates a lack of consensus about the theory.
Many of these debates turn on a misunderstanding of the term. In formal usage, consensus is not
synonymous with unanimitynor with having achieved a simple majority. Instead, consensus connotes
broad agreement after a process of deliberation, during which time most members of a group
coalesce around a particular idea or alternative. (Such as in: We reached a consensus to get Chinese
food for lunch, but Horatio decided to get pizza instead.)
A consensus-driven process, in fact, often represents an alternative to voting. Sometimes when a
political party is trying to pick a presidential nominee, one candidate will perform so strongly in
early-voting states like Iowa and New Hampshire that all the others drop out. Even though the
candidate is far from having clinched the nomination mathematically, there may be no need for the
other states to hold a meaningful vote if the candidate has demonstrated that he is acceptable to most
key coalitions within the party. Such a candidate can be described as having won the nomination by
consensus.
Science, at least ideally, is exactly this sort of deliberative process. Articles are published and
conferences are held. Hypotheses are tested, findings are argued over; some survive the scrutiny
better than others.
* Nicholas Dawidoff, The Divil Heretic, New York Times Magazine, March 25, 2009.
http://www.nytimes.com/2009/03/29/ma...pagewanted=all
The IPCC is potentially a very good example of a consensus process. Their reports take years to produce
and every finding is subject to a thoroughif somewhat byzantine and bureaucraticreview process.
By convention, every review remark has to be addressed, Rood told me. If your drunk cousin wants
to make a remark, it will be addressed.
The extent to which a process like the IPCCs can be expected to produce better predictions is more
debatable, however. There is almost certainly some value in the idea that different members of a group
can learn from one anothers expertise. But this introduces the possibility of groupthink and herding.
Some members of a group may be more influential because of their charisma or status and not
necessarily because they have the better idea. Empirical studies of consensus-driven predictions have
found mixed results, in contrast to a process wherein individual members of a group submit
independent forecasts and those are averaged or aggregated together, which can almost always be
counted on to improve predictive accuracy.
The IPCC process may reduce the independence of climate forecasters. Although there are nominally
about twenty different climate models used in the IPCCs forecast, they make many of the same
assumptions and use some of the same computer code; the degree of overlap is significant enough
that they represent the equivalent of just five or six independent models. And however many models
there are, the IPCC settles on just one forecast that is endorsed by the entire group.
Climate Scientists Are Skeptical About Computer Models
Its critical to have a diversity of models, I was told by Kerry Emanuel, an MIT meteorologist who is one
of the worlds foremost theorists about hurricanes. You do not want to put all your eggs in one basket.
One of the reasons this is so critical, Emanuel told me, is that in addition to the different
assumptions these models employ, they also contain different bus. Thats something nobody likes to
talk about, he said. Different models have different coding errors. You cannot assume that a model
with millions and millions of lines of code, literally millions of instructions, that there isnt a mistake in
there.
If youre used to thinking about the global warming debate as series of arguments between skeptics
and believers, you might presume that this argument emanates from a scientist on the skeptical side
of the aisle. In fact, although Emanuel has described himself as conservative and Republican*--which is
brave enough at MIThe would probably not think of himself as a global warming skeptic. Instead, he is
a member in good standing of the scientific establishment, having been elected to the National
Academy of Sciences. His 2006 book presented a basically consensus (and extremely thoughtful and
well-written) view on climate science. [Kerry Emanuel, What We Know About Climate Change
(Boston: MIT Press, 2007).
http://www.amazon.com/About-Climate-.../dp/0262050897
* Neela Banerjee, Scientist Proves Conservatism and Belief in Climate Change Arent Incompatible,
Los Angeles Times, January 5, 2011.
http://articles.latimes.com/2011/jan...imate-20110105
Emanuels concerns are actually quite common among the scientific community: climate scientists are in
much broader agreement about some parts of the debate than others. A survey of climate scientists
conducted in 2008* found that almost all (94 percent) were agreed that climate change is occurring
now, and 84 percent were persuaded that it was the result of human activity. But there was much less
agreement about the accuracy of climate computer models. The scientists held mixed views about the
ability of these models to predict global temperatures, and generally skeptical ones about their capacity
to model other potential effects of climate change. Just 19 percent, for instance, thought they did a
good job of modeling what sea-rise levels will look like fifty years hence.
* Dennis Bray and Hans von Storch, CliSci2008: A Survey of the Perspectives of Climate Scientists
Concerning Climate Science and Climate Change, Institute for Coastal Research, 2008.
http://coast.gkss.de/staff/storch/pdf/CliSci2008.pdf
Results like these ought to be challenging to anyone who takes a caricatured view of climate science.
They should cut against the notion that scientists are injudiciously applying models to make fantastical
predictions about the climate; instead, the scientists have as much doubt about the models as many of
their critics. [And these doubts are not just expressed anonymously; the scientists are exceptionally
careful, in the IPCC reports, to designate exactly which findings they have a great deal of confidence
about and which they see as more speculative.] However, cinematographic representations of climate
change, like Al Gores An Inconvenient Truth, have sometimes been less cautious, portraying a
polar bear clinging to life in the Arctic, or South Florida and Lower Manhattan flooding over.* Films like
these are not necessarily a good representation of scientific consensus. The issues that climate
scientists actively debate are much more banal: for instance, how do we develop computer code to
make a good representation of a cloud?
* Ronald Bailey, An Inconvenient Truth: Gore as Climate Exaggerator, Reason.com, June 16, 2006.
http://reason.com/archives/2006/06/1...nvenient-truth
- pp. 388-389 (Beyond a Cookbook Approach to Forecasting): The criticisms that Armstrong and Green
make about climate forecasts derive from their empirical study of disciplines like economics in which
there are few such physical models available and the causal relationships are poorly understood. Overly
ambitious approaches toward forecasting have often failed in these fields, and so Armstrong and Green
infer that they will fail in climate forecasting as well. [Gavin Schmidt, Green and Armstrongs Scientific
Forecast, RealClimate.org, July 20, 2007.
http://www.realclimate.org/index.php...ific-forecast/
The goal of any predictive model is to capture as much signal as possible and as little noise as
possible. Striking the right balance is not always so easy, and our ability to do so will be dictated by
the strength of the theory and the quality and quantity of the data. In economic forecasting, the data is
very poor and the theory is weak, hence Armstrongs argument that the more complex you make the
model the worse the forecast gets.
In climate forecasting, the situation is more equivocal: the theory about the greenhouse effect is
strong, which supports more complicated models. However, temperature data is very noisy, which
argues against them. Which consideration wins out? We can address this question empirically, by
evaluating the success and failure of different predictive approaches in climate science. What matters
most, as always, is how well the predictions do in the real world.
I would urge caution against reducing the forecasting process to a series of bumper-sticker slogans.
Heuristics like Occams razor (other things being equal, a simpler explanation is better than a more
complex one*) sound sexy, but they are hard to apply. We have seen cases, as in the SIR models
used to forecast disease outbreaks, where the assumptions of a model are simple and elegantbut
where they are much too naive to provide for very skillful forecasts. We have also seen cases, as in
earthquake prediction, where unbelievably convoluted forecasting schemes that look great in the
software package fail miserably in practice.
An admonition like The more complex you make the model the worse the forecast gets is equivalent
to saying Never add too much salt to the recipe. How much complexityhow much saltdid you
begin with? If you want to get good at forecasting, youll need to immerse yourself in the craft and
trust your own taste buds.
* Occams Razor; Wikipedia.org. http://en.wikipedia.org/wiki/Occams_razor
- p. 391 (Uncertainty in Climate Forecasts): Central Park happens to have a particularly good
temperature record; it dates back to 1869* . . . I have plotted the monthly average temperature for
Central Park in the century encompassing 1912 through 2011 . . . . the temperature fluctuates
substantially (but predictably enough) from warm to cool and back againa little more so in some years
than others. In comparison to the weather, the climate signal is barely noticeable. But it does exist:
temperatures have increased by perhaps 4 [degrees Fahrenheit] on average over the course of this
one-hundred-year period in Central Park.
* Average Monthly & Annual Temperatures at Central Park, Eastern Regional Headquarters, National
Weather Service. http://www.erh.noaa.gov/okx/climate/...nnualtemp.html
- pp. 394-398 (A Note on the Temperature Record): A more recent entrant into the temperature
sweepstakes are observations from satellites. The most commonly used satellite records are from the
University of Alabama at Huntsville and from a private company called Remote Sensing Systems. The
satellites these records rely on do not take the temperature directlyinstead, they infer it by
measuring microwave radiation. But the satellites estimates of temperatures in the lower
atmosphere provide a reasonably good proxy for surface temperatures.
The temperature records also differ in how far they track the climate backward; the oldest are the
observations from the UKs Met Office, which date back to 1850; the satellite records are the youngest
and date from 1979. And the records are measured relative to different baselinesthe NASA/GISS
record is taken relative to average temperatures from 1951 through 1980, for instance, while
NOAAs temperatures are measured relative to the average throughout the twentieth century. But this
is easy to correct for, and the goal of each system is to measure how much temperatures are rising or
falling rather than what they are in any absolute sense.
Reassuringly, the differences between the various records are fairly modest . . . All six show both 1998
and 2010 as having been among the three warmest years on record, and all six show a clear long-term
warming trend, especially since the 1950s when atmospheric CO2 concentrations began to increase at a
faster rate. For purposes of evaluating the climate forecasts, Ive simply averaged the six temperate
records together.
James Hansens Predictions
One of the more forthright early efforts to forecast temperature rise came in 1981, when Hansen and
six other scientists published a paper in the esteemed journal Science.* These predictions, which
were based on relatively simple statistical estimates of the effects of CO2 and other atmospheric
gases rather than a fully fledged simulation model, have done quite well. In fact, they very slightly
underestimated the amount of global warming observed through 2011. [Geert Jan van Oldenborgh and
Rein Haarsma,Evaluating a 1981 Temperature Projection, RealClimate.org, April 2, 2012.
http://www.realclimate.org/index/php...re-projection/
* J. Hansen, et al. Climate Impact of Increasing Atmospheric Carbon Dioxide, Science, 213,
4511(August 28, 1981).
http://thedgw.org/definitionsOut/..%...easing_co2.pdf
Hansen is better known, however, for his 1988 congressional testimony as well as a related 1988 paper
that he published in the Journal of Geophysical Research. This set of predictions did rely on a
three-dimensional physical model of the atmosphere. [J. Hansen, et al., Global Climate Changes as
Forecast by Goddard Institute for Space Studies Three-Dimensional Model, Journal of Geophysical
Research, 93, D8 (August 20, 1988), pp. 9341-9364. http://pubs.giss.nasa.gov/abs/ha02700w.html
Hansen told Congress that Washington could expect to experience more frequent hot
summers. In his paper, he defined a hot summer as one in which average temperatures in Washington
were in the top one-third of the summers observed from 1950 through 1980. He said that by the 1990s,
Washington could expect to experience these summers 55 to 70 percent of the time, or roughly twice
their 33 percent baseline rate.
In fact, Hansens prediction proved to be highly prescient for Washington, DC. In the 1990s, six of the
ten summers qualified as hot . . . right in line with his prediction. About the same rate persisted in the
2000s and Washington experienced a record heat wave in 2012 . . . .
The IPCCs 1990 Predictions
The IPCCs 1990 forecasts represented the first true effort at international consensus predictions in the
field and therefore received an especially large amount of attention. These predictions were less
specific than Hansens, although when they did go into detail they tended to get things mostly
right. For instance, they predicted that land surfaces would warm more quickly than water surfaces,
especially in the winter, and that there would be an especially substantial increase in temperature in
the Arctic and other northerly latitudes. Both of these predictions have turned out to be correct.
The headline forecast, however, was that of the global temperature rise . . . .
The IPCC forecasts were predicated on a business-as-usual case that assumed that there would be no
success at all in mitigating carbon emissions. This scenario implied that the amount of atmospheric CO2
would increase to about four hundred parts per million (ppm) by 2010. In fact, some limited efforts to
reduce carbon emissions were made, especially in the European Union, and this projection was
somewhat too pessimistic; CO2 levels had risen to about 390 ppm as of 2010. In other words, the
error in the forecast in part reflected scenario uncertaintywhich turns more on political and
economic questions than on scientific onesand the IPCCs deliberately pessimistic assumptions
about carbon mitigation efforts. [If you scale back their warming estimates to reflect the
smaller-than-assumed rate of CO2 increase, you wind up with a revised projection of 1.4 [degrees
Celsius] to 3.6 [degrees Celsius] in warming per century. The actual rate of increase, a pace of 1.5
[degrees Celsius] per century since the report was published, falls within this range, albeit barely.]
Nevertheless, the IPCC later acknowledged their predictions had been too aggressive. When they
issued their next forecast, in 1995, the range attached to their business-as-usual case had been
revised considerably lower: warming at a rate of about 1.8 [degrees Celsius] per century. This
version of the forecasts has done quite well relative to the actual temperature trend.* Still, that
represents a fairly dramatic shift. It is right to correct a forecast when you think it might be wrong
rather than persist in a quixotic fight to the death for it. But this is evidence of the uncertainties
inherent in predicting the climate.
* Pielke, Jr., Verification of IPCC Temperature Forecasts 1990, 1995, 2001, and 2007.
http://cstpr.colorado.edu/prometheus...n_of_ipcc.html
The score you assign to these early forecasting efforts overall might depend on whether you are
grading on a curve. The IPCCs forecast miss in 1990 is partly explained by scenario uncertainty. But
this defense would be more persuasive if the IPCC had not substantially changed its forecast just
five years later. On the other hand, their 1995 temperature forecasts have gotten things about right,
and the relatively few specific predictions they made beyond global temperature rise (such as ice
shrinkage in the Arctic*) have done quite well. If you hold forecasters to a high standard, the IPCC
might deserve a low but not failing grade. If instead you have come to understand the history of
prediction is fraught with failure, they look more decent by comparison.
* Julienne Stroeve, Marika M. Holland, Walt Meier, Ted Scambos, and Mark Serreze, Arctic Sea Ice
Decline: Faster Than Forecast, Geophysical Research Letters, 34, 2007.
http://www.ualberta.ca/~eec/Stroeve2007.pdf
Uncertainty in forecasts is not necessarily a reason not to actthe Yale economist William Nordhaus
has argued instead that it is precisely the uncertainty in climate forecasts that compels action,* since
the high-warming scenarios could be quite bad. Meanwhile, our government spends hundreds of
billions toward economic stimulus programs, or initiates wars in the Middle East, under the pretense of
what are probably far more speculative forecasts than are pertinent in climate science. [Richard B.
Rood, Maria Carmen Lemos, and Donald E. Anderson, Climate Projections: From Useful to Usability,
University of Michigan, December 15, 2010.
http://www.google.com/url?sa=t&rct=j...UTj6czOP-WnegQ
* William Nordhaus, The Challenge of Global Warming: Economic Models and Environmental Policy,
2007. http://nordhaus.econ.yale.edu/dice_mss_072407_all.pdf
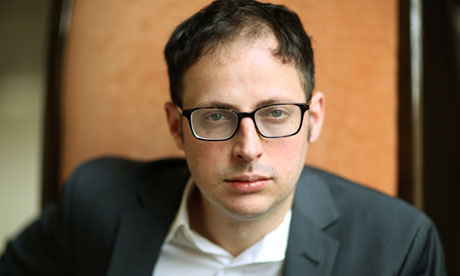
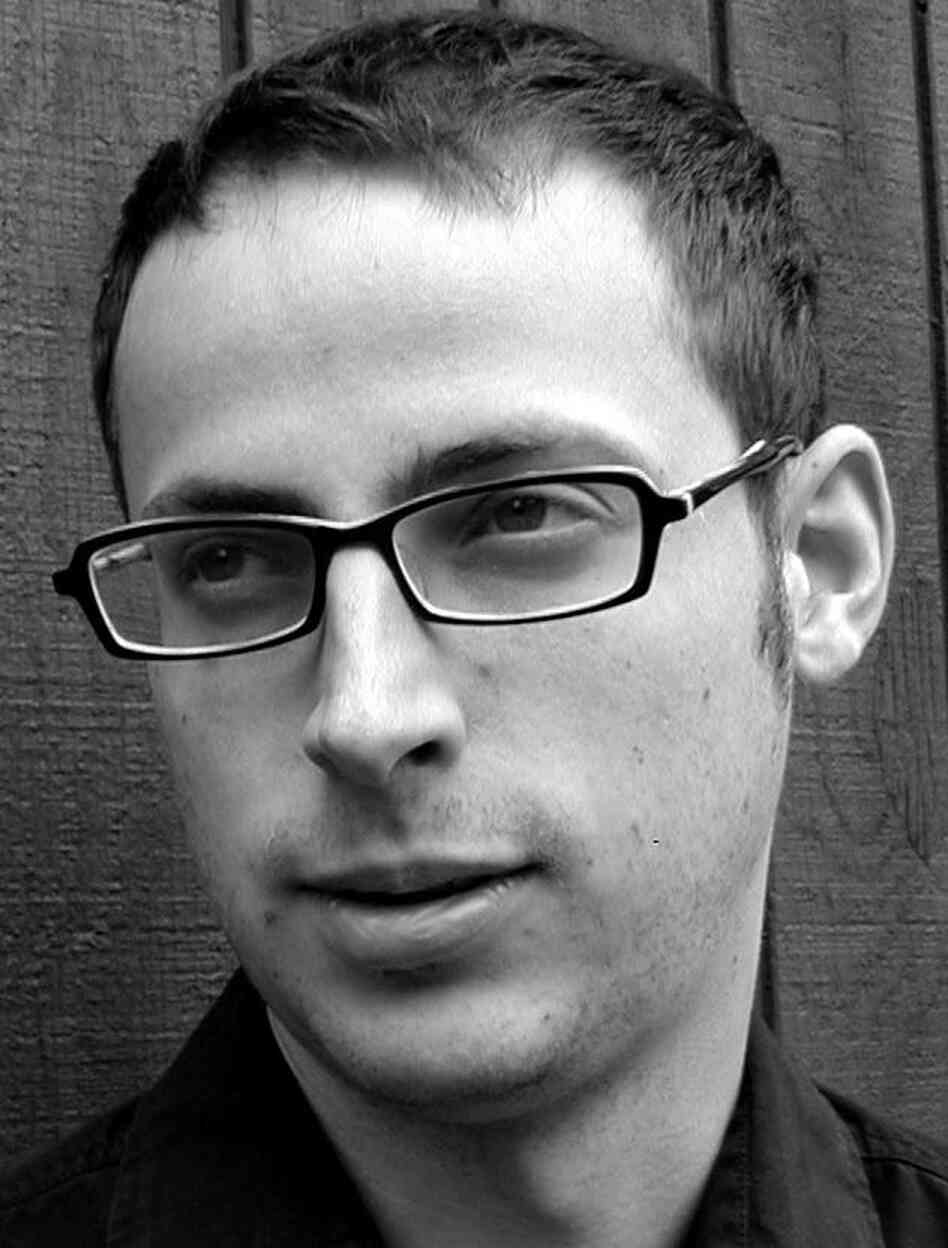
-
Found this through Google.
Based on the podcasts and interviews I've seen, I think LIE, but ILI-Te is obviously close to that, too.
 Posting Permissions
- You may not post new threads
- You may not post replies
- You may not post attachments
- You may not edit your posts
-
Forum Rules


 Reply With Quote